
Spotting chart patterns is a popular hobby amongst traders of all skill levels, and one of the easiest patterns to spot is a triangle pattern. However, there is more than one kind of triangle to find, and there are a couple of ways to trade them. Here are some of the more basic methods to both finding and trading these patterns.
What is an ascending triangle?
The ascending triangles form when the price follows a rising trendline. However, the trend consolidates, failing to make new highs.
Ascending triangles are considered to be continuation patterns. Therefore, a break of the resistance prompts a rally.
The pattern is negated if the price breaks below the upward sloping trendline.
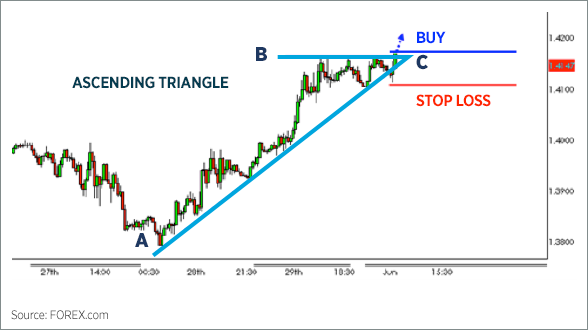
The example below of the EUR/USD (Euro/U.S. Dollar) illustrates an ascending triangle pattern on a 30-minute chart. After a prolonged uptrend marked by an ascending trendline between A and B, the EUR/USD temporarily consolidated, unable to form a new high or fall below the support. The pair reverted to test resistance on three distinct occurrences between B and C, but it was incapable of breaking it.
The ascending triangle pattern formed once a horizontal resistance and ascending support lines acted as buffers for the price action. Finally, EUR/USD breached resistance at E, signaling a potential bullish breakout.EUR/USD
How can you trade ascending triangles?
Typically you want to buy after the pattern breaks resistance, as it did at E. It is good practice to set a stop-loss just below the last significant low, which in this example is at D.
Look at the chart below, a continuation of the EUR/USD. Once the ascending triangle formation is formed, we wait for a confirmation candle to signal a breakout. Since the following candle (at F) continued to advance higher, we enter the position at 1.4160, while placing our stop-loss slightly below the previous significant low at 1.4110 (a 50-pip difference from the buy price).
The EUR/USD rallies upward in line with our desired direction. The pair advances roughly 100 pips before consolidating once more at G, providing us with a 2:1 reward-to-risk ratio.
EUR/USD

What is a descending triangle?
Not surprisingly, the descending triangle is the opposite of the ascending triangle. It forms when the price follows a downward trendline and then consolidates, failing to make new lows or break a downward trendline.
Descending triangles are considered continuation patterns. Therefore, a break in the support prompts the price to fall.
The pattern is negated if the price breaks the downward sloping trendline.
NZD/USD

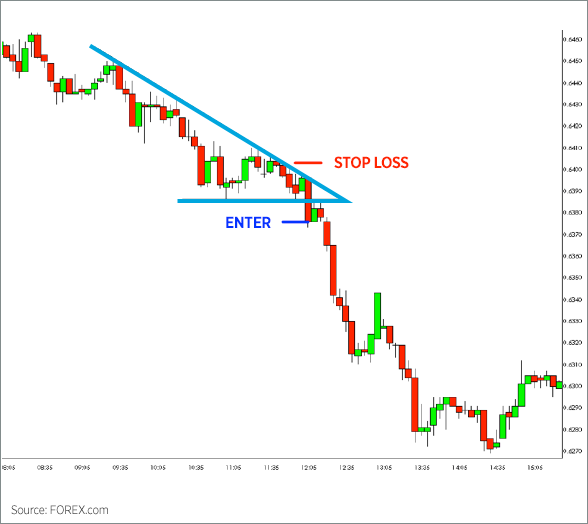
The example above of the NZD/USD (New Zealand Dollar/U.S. Dollar) illustrates a descending triangle pattern on a five-minute chart. After a downtrend which followed a descending trendline between A and B, the pair temporarily consolidated between B and C, unable to make a new low. The pair reverted to test resistance on two distinct occurrences, but it was incapable of breaking out to the upside at D. The pattern formed a horizontal support while descending resistance lines acted as buffers for the price action. Finally, the NZD/USD breached the resistance at E, signaling a potential bearish breakdown.
How can we trade descending triangles?
Typically you want to buy after the pattern breaks resistance, as it did at E. It is good practice to set a stop-loss just below the last significant high, which in this example is at D.
Look at the chart below, which is a continuation of the NZD/USD chart above. Once the descending triangle formation is completed, we wait for a candle to breakout from the pattern, as it did at E. We sell short NZD/USD at 0.6375, while placing our stop-loss slightly above the previous significant high at 0.6405 (a 30-pip difference from the sell price). NZD/USD tumbles in our desired direction.
The pair descends roughly 90 pips before consolidating once more at F, providing a 3:1 reward-to-risk ratio. Considering this is a five-minute chart, the profits and risks are generally smaller than if the pattern appeared on a larger timeframe.
NZD/USD
What is a symmetrical triangle?
The pattern is identified by two discrete trendlines. The first trendline connects a series of lower peaks, while the second trendline connects a series of higher troughs.
Symmetrical triangles generally form during consolidation and the volatility tends to decline as the pattern progresses.
Symmetrical triangles tend to be neutral and can signal either a bullish or a bearish situation. Therefore, a breakout from the pattern in either direction signals a new trend.
NZD/USD
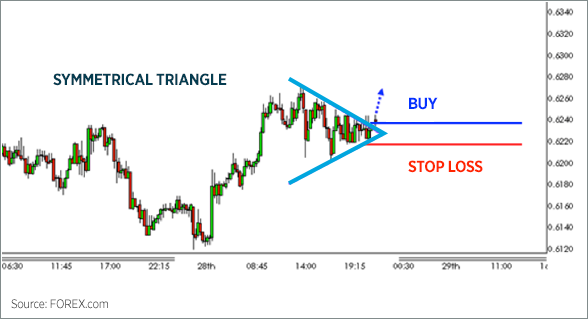
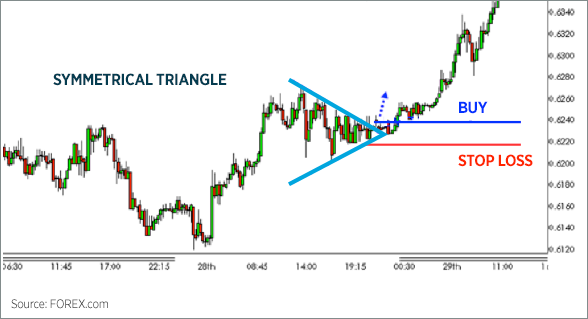
The example above of the NZD/USD illustrates a symmetrical triangle formation on a 15-minute chart. After a rapid uptrend, the pair consolidated between A and B, unable to find a distinct trend. During the consolidating state, the pair continued to form a series of lower peaks and higher troughs. Volatility dropped off considerably, if compared to the beginning of the formation. Ultimately, the pattern ended when both of the trendlines came together at C.
How can we trade symmetrical triangles?
Since bias upon the conclusion of the pattern pointed higher, we look for an opportunity to buy the pair. Given the candle following the conclusion of the trend rallied at D, we bought NZD/USD at 0.6240. We place our stop-loss slightly below the most recent significant low at 0.6215 (a 25-pip difference from the buy price). The pair continued to consolidate prior to rallying approximately 80 pips at E. Considering this is a 15-minute chart, the profits and risks are generally smaller than if the pattern appeared on a larger timeframe.
NZD/USD