Basics
• Forex stands for Foreign Exchange, which is exchanging one currency for another.
• You sell one currency and buy another currency simultaneously and once you do so you have essentially involved yourself in the forex market
Basics
• The market is open 24-hours a day, 5 days a week and has different sessions depending on what time it is.

• Forex is the largest financial market with a daily turnover of more than $5 trillion.

• Currencies are always quoted in pairs, such as USD/ZAR, where you exchange USD for ZAR.
e.g.
• USD/ZAR = 13.3971
USD: Base Currency
ZAR: Quote Currency
Terminology
• Base Currency: The base currency is the “basis” for the buy or the sell.
• Quote Currency:The quote currency is the second currency in any currency pair
• Long/Bullish: In trader's talk going long/Bullish means BUY
• Short/Bearish: In trader's talk going Short/Bearish means SELL
• Pip: Percentage In point –A pip is the smallest price movement available in a currency.
The 4th decimal number e.g.
USD/ZAR = 13.39710 If USD/ZAR moves from 13.39710 to 13.39720= 1 pip
Instances where you have USD/JPY = 100.509 use 3rd decimal number as your pip
• Lot Size: Value used to determine profit or loss.
Micro Lot Size : 0.01 = 10 cent per pip
Mini Lot size : 0.10 = $1 per pip
Standard Lot size : 1.00 = $10 per pip
Market Order: A market order is an order to buy or sell at the current market price.
BUY: USD/ZAR Current Market price = 13.3971
Pending Order: Is an order to buy or sell at a price above or below the current price.
BUY: USD/ZAR at price = 13.4001
Take Profit: A level where you decide to exit a trade with profit
Stop Loss: A level where you decide to exit a trade with a loss
Types of Trading
Fundamental analysis:
Fundamental analysis is a way of looking at the market through economic, social and political forces that affect supply and demand.

Technical Analysis:
Technical analysis is the study of price movement. In one word, technical analysis = charts

Price action is a trading
technique that allows the trader to analyse the market and make subjective
trading decisions based on past and present price movements.
Price action trading uses tools like chart
patterns, candlestick patterns, trendlines, support & resistance and many
more.
BAR
CHART
Shows opening price, while simultaneously showing the
closing price, as well as the highs and lows

CANDLESTICK CHART
Also shows opening price, while simultaneously showing the
closing price, as well as the highs and lows.

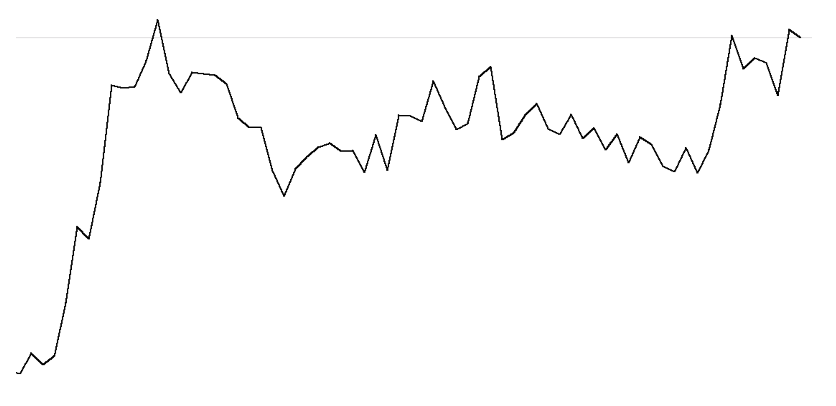
LINE CHART
A simple chart that draws a line from one closing price to
the next closing price.
Bullish
Candlestick (BUY)
A Bullish candlestick simply means the price opened lower
and closed up higher after a certain time period


SUPPORT & RESISTANCE
• Support: Lowest point the price reaches
before reversing.
• Resistance: Highest point the price
reaches before reversing.
e.g.
• Look
at support as the floor.
• Look at resistance as the ceiling.

Broken support turns into resistance and broken resistance turns into support.

We
call these support and resistance area’s by one word— zones.
1. Important characteristics of
zones are as follows:
2. Zones are an area, not a price
point.
3. Zones are spots on the chart
where price reverses, repeatedly.
4. Zones may be extreme highs or
lows on the chart.
5. Zones are where naked traders
find trading opportunities.
6. Support and resistance zones
rarely need to be modified.
7. Line charts help naked traders
find zones.


How to
find zones:
1.
Start with a higher timeframe chart (Daily).
2.
Use a line chart to find the zones.
3.
Plot your zone where prices keeps reversing
repeatedly.
4.
Check if zone was once a support or resistance
before
BUYING & SELLING PRESSURE
Understanding buying and selling pressure on candlesticks.
Every candlestick that forms tells you a story about the
battle between the Buyers (Bulls) and Sellers (Bears), who dominated the
battle, who is weakening and who finally won.


So far we have been looking at individual candlesticks, what
if we combine more than one candlestick? What does that show us?
• A group of candlesticks can show you how strong or weak a
bullish or bearish move is.
• They can also show us if a bullish or bearish move is
weakening.
• The word used to describe such a situation is momentum.


TRAINING WILL CONTINUE LATER.............
THANK YOU GUYS FOR READING THIS ARTICLE I WILL CONTINUE LATER
COMMENT ANYTHING IF YOU NEED MORE HELP AND LET ME KNOW THROUGH THE COMMENTS